We have run some of the match results through our databases, ran the algorithms and come out with some interesting displays of stats for you to either enjoy, or not if you don't like what you see.
A simple case of compare and contrast is key with many of these graphs which we will detail in greater depth.
For many of these graphs the possession stats were taken from the BBC webpage for who had what possession, so we take no responsibility for any of that data being inaccurate. That's a lovely get out clause to use.
1) First lets do a basic breakdown of results so far in the Championship.
Things are fairly evenly spread. With slightly more draws than anything else, its easy to see that we have lost less than anything. This however doesn't take recent form into an immediate view, as this is the whole season. We will look at recent form in more depth soon, but for now we are looking at this wider context. I think with the division being as competative as it is, its vital we keep defeats as the lowest of the three. Before we'd kicked a ball this season I think a ratio as above is what we;d frankly expect, but as said form has skewed views. But lets break this down further.
Home form does somewhat out perform away so thats as expected, but converting draws to wins at home is where the data shows a pattern. Defeat both sit at a similar percentage, but we have less draws and more wins at home than away. So whereas versus Fulham at home we came back to win, for instance against Watford away we only drew. But that doesn't tell all the story. How about we look by who scored first.
A simple case of compare and contrast is key with many of these graphs which we will detail in greater depth.
For many of these graphs the possession stats were taken from the BBC webpage for who had what possession, so we take no responsibility for any of that data being inaccurate. That's a lovely get out clause to use.
1) First lets do a basic breakdown of results so far in the Championship.
 |
| fig 1. Results broken into % |
2) By running home and away and breaking then down into the results, traditionally in football you'd expect home form to outstrip away form. Heres the graph.
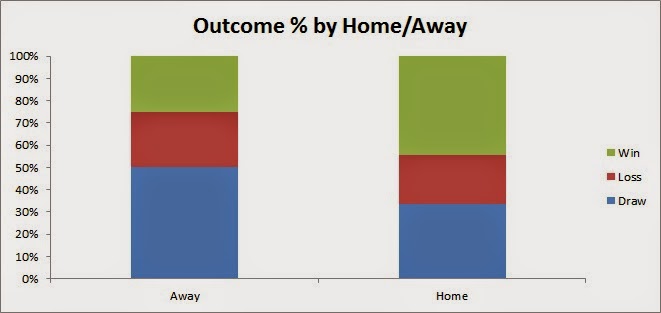 |
| fig 2. Outcome by Home/ Away |
Home form does somewhat out perform away so thats as expected, but converting draws to wins at home is where the data shows a pattern. Defeat both sit at a similar percentage, but we have less draws and more wins at home than away. So whereas versus Fulham at home we came back to win, for instance against Watford away we only drew. But that doesn't tell all the story. How about we look by who scored first.
3) You would expect that if we are to turn more defeats to draws and draws to wins, we need to be scoring first more often, or maybe not. maybe falling behind galvanises the side into rallying round. Heres the data
Now obviously there are draws to consider where there are no goals. But by and large according to the data is an obvious pattern. We score first, and we will be more likely to win. The opposition score first, and we are more likely to lose. Its a simple equation, and proves that these early slip ups and disasters of late have hit us hard points wise. So maybe this might tie in with possession stats.
Now this may be immediately confusing so lets break it down. The % on the left axis is nothing to do with possession stats. That is win percentages. The colour coding is where we are looking at and the key is on the right. For ease of analysis we broke it down into 4 main areas. Below 45%, between 45 and 50%. Then 50-55% and anything plus. This is Forest possession in a game. What to me is frankly amazing is that the opposite of what i thought is true. The less we have the ball, the more games we win it seems. The draws are a bit of a mixed bag to look into, so if we ignore them, when we have lost we have had more possession in every single occasion. Maybe by a slender margin, but nonetheless, we have had more of the ball. And largely when we win, we have had less of the ball. Now make of this what you will. Whether it us sitting back on counter attacking, and then scoring to win, or whether it is a case of having the same done to us., it is still an interesting pattern.
Easy. If we score first, we are way more likely to win. In all cases as above. In fact at home results are equally measured if the opposition score first what the outcome will be. If Forest score first at home, save for the Blackburn game, we get a result. But away from home the same is true, that we largely lose if we discount the Bournemouth game.
 |
| fig 3, First scorer (team) by Result |
4) Like with goals you'd think more possession means more chance of Forest winning. If we have the ball the opposition aren't scoring for one thing. Although I'm not saying we are playing tiki-taka (it's dead remember) you'd hope something like that is they case.
 |
| fig 4. Results by Possession Stats |
So what if we look further?
5) This is where we get quite complex. If we run the same basic data as in 3 and 4 but add in a check on home and away games, we get this graph.
Ok so as we said the less we have the ball the more we seem to win right? By throwing in the curve ball of where the game was played it seems that away from home, teams let us have the ball but then still win, or get a result. In fact games where have the ball the least away from home we will more likely draw. Home games see possession more in the middle sections, much more a share of the ball than away. If the away team has the lionshare of the ball we are more likely to win.
 |
| fig 5. Home / Away, with result by Possession |
6) So finally what about a home/away comparison of first goalscorer.
 |
| fig 6. Home /Away, with result by First Scorer |
Easy. If we score first, we are way more likely to win. In all cases as above. In fact at home results are equally measured if the opposition score first what the outcome will be. If Forest score first at home, save for the Blackburn game, we get a result. But away from home the same is true, that we largely lose if we discount the Bournemouth game.
So what does all of this tell us? That the division is a bit crazy, but there are definite patterns emerging, just somewhat confusing patterns. We will continue to monitor this and give further updates,
Comments
Post a Comment