last updated 06/08/2017
Player Stats
Similar to the goal stats, we have a page of stats were we look in high detail at match data. Basically mins played, mins per goal ratios etc. These will make an interesting build up as we get further into the season.
Every table and graph should be rather self explanatory but some is quite in depth. We will talk in depth in periodic articles on the data, whereas these pages are kind of just data dumps for now.
Player Stats - Mins Played in General
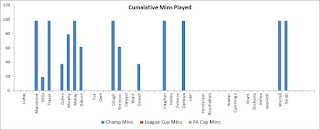
As it says, a simple dump of mins played cumulatively in all competitions per player. Click on graph for larger version. The minutes are overall and include injury time, so basically it won't add up to games played X 90 mins, but every minute.
The next chart just is a simple stick chart, which has two elements making up its total. Part is League Mins played the other is League Cup. So you can see where rotation etc is occurring
Rather than above being a cumulative total, the below is a % of League Mins played by various players. As before we will update this periodically with no commentary but run actual articles with commentary separately.
Player Stats: Minutes Played - Ratios
These next two take a lot of explaining. Basically we have calculated and ordered by the % sums of total mins each player has played, in all comps. Then, we have added a column which calculates based on the games they have played in, what is the average sum of minutes. This becomes apparent where players have missed games, but still retain high levels of mins played per match, but low % of total mins. So if a player has returned from an injury, he will have a lower % of mins played, but his sum of minutes played should be proportionately off. Those used often as substitutes will show up heavily skewed on here as the season progresses, as will those regularly substituted, who will have high minutes of minutes played but minutes in the 60-70 region. In Table form and graph form
These next two are two and the same presented differently. In basic table format we have calculated how many mins played by that player it is per goal. Simple maths of dividing mins played by goals scored. We have filtered all the none scorers out, because it'd be pointless data. The bar chart is odd because conversely you don;t want to have a high score, but a lower score.
Win Ratio's
Furthermore we have put together a table that calculates each players win percentages. This is from a start or sub performance. It works out these ratios, for overall matches and league matches.


Comments
Post a Comment